
AI Chart Imagery, Animated
I introduced AI and motion graphics to facilitate digestion and engagement of content.
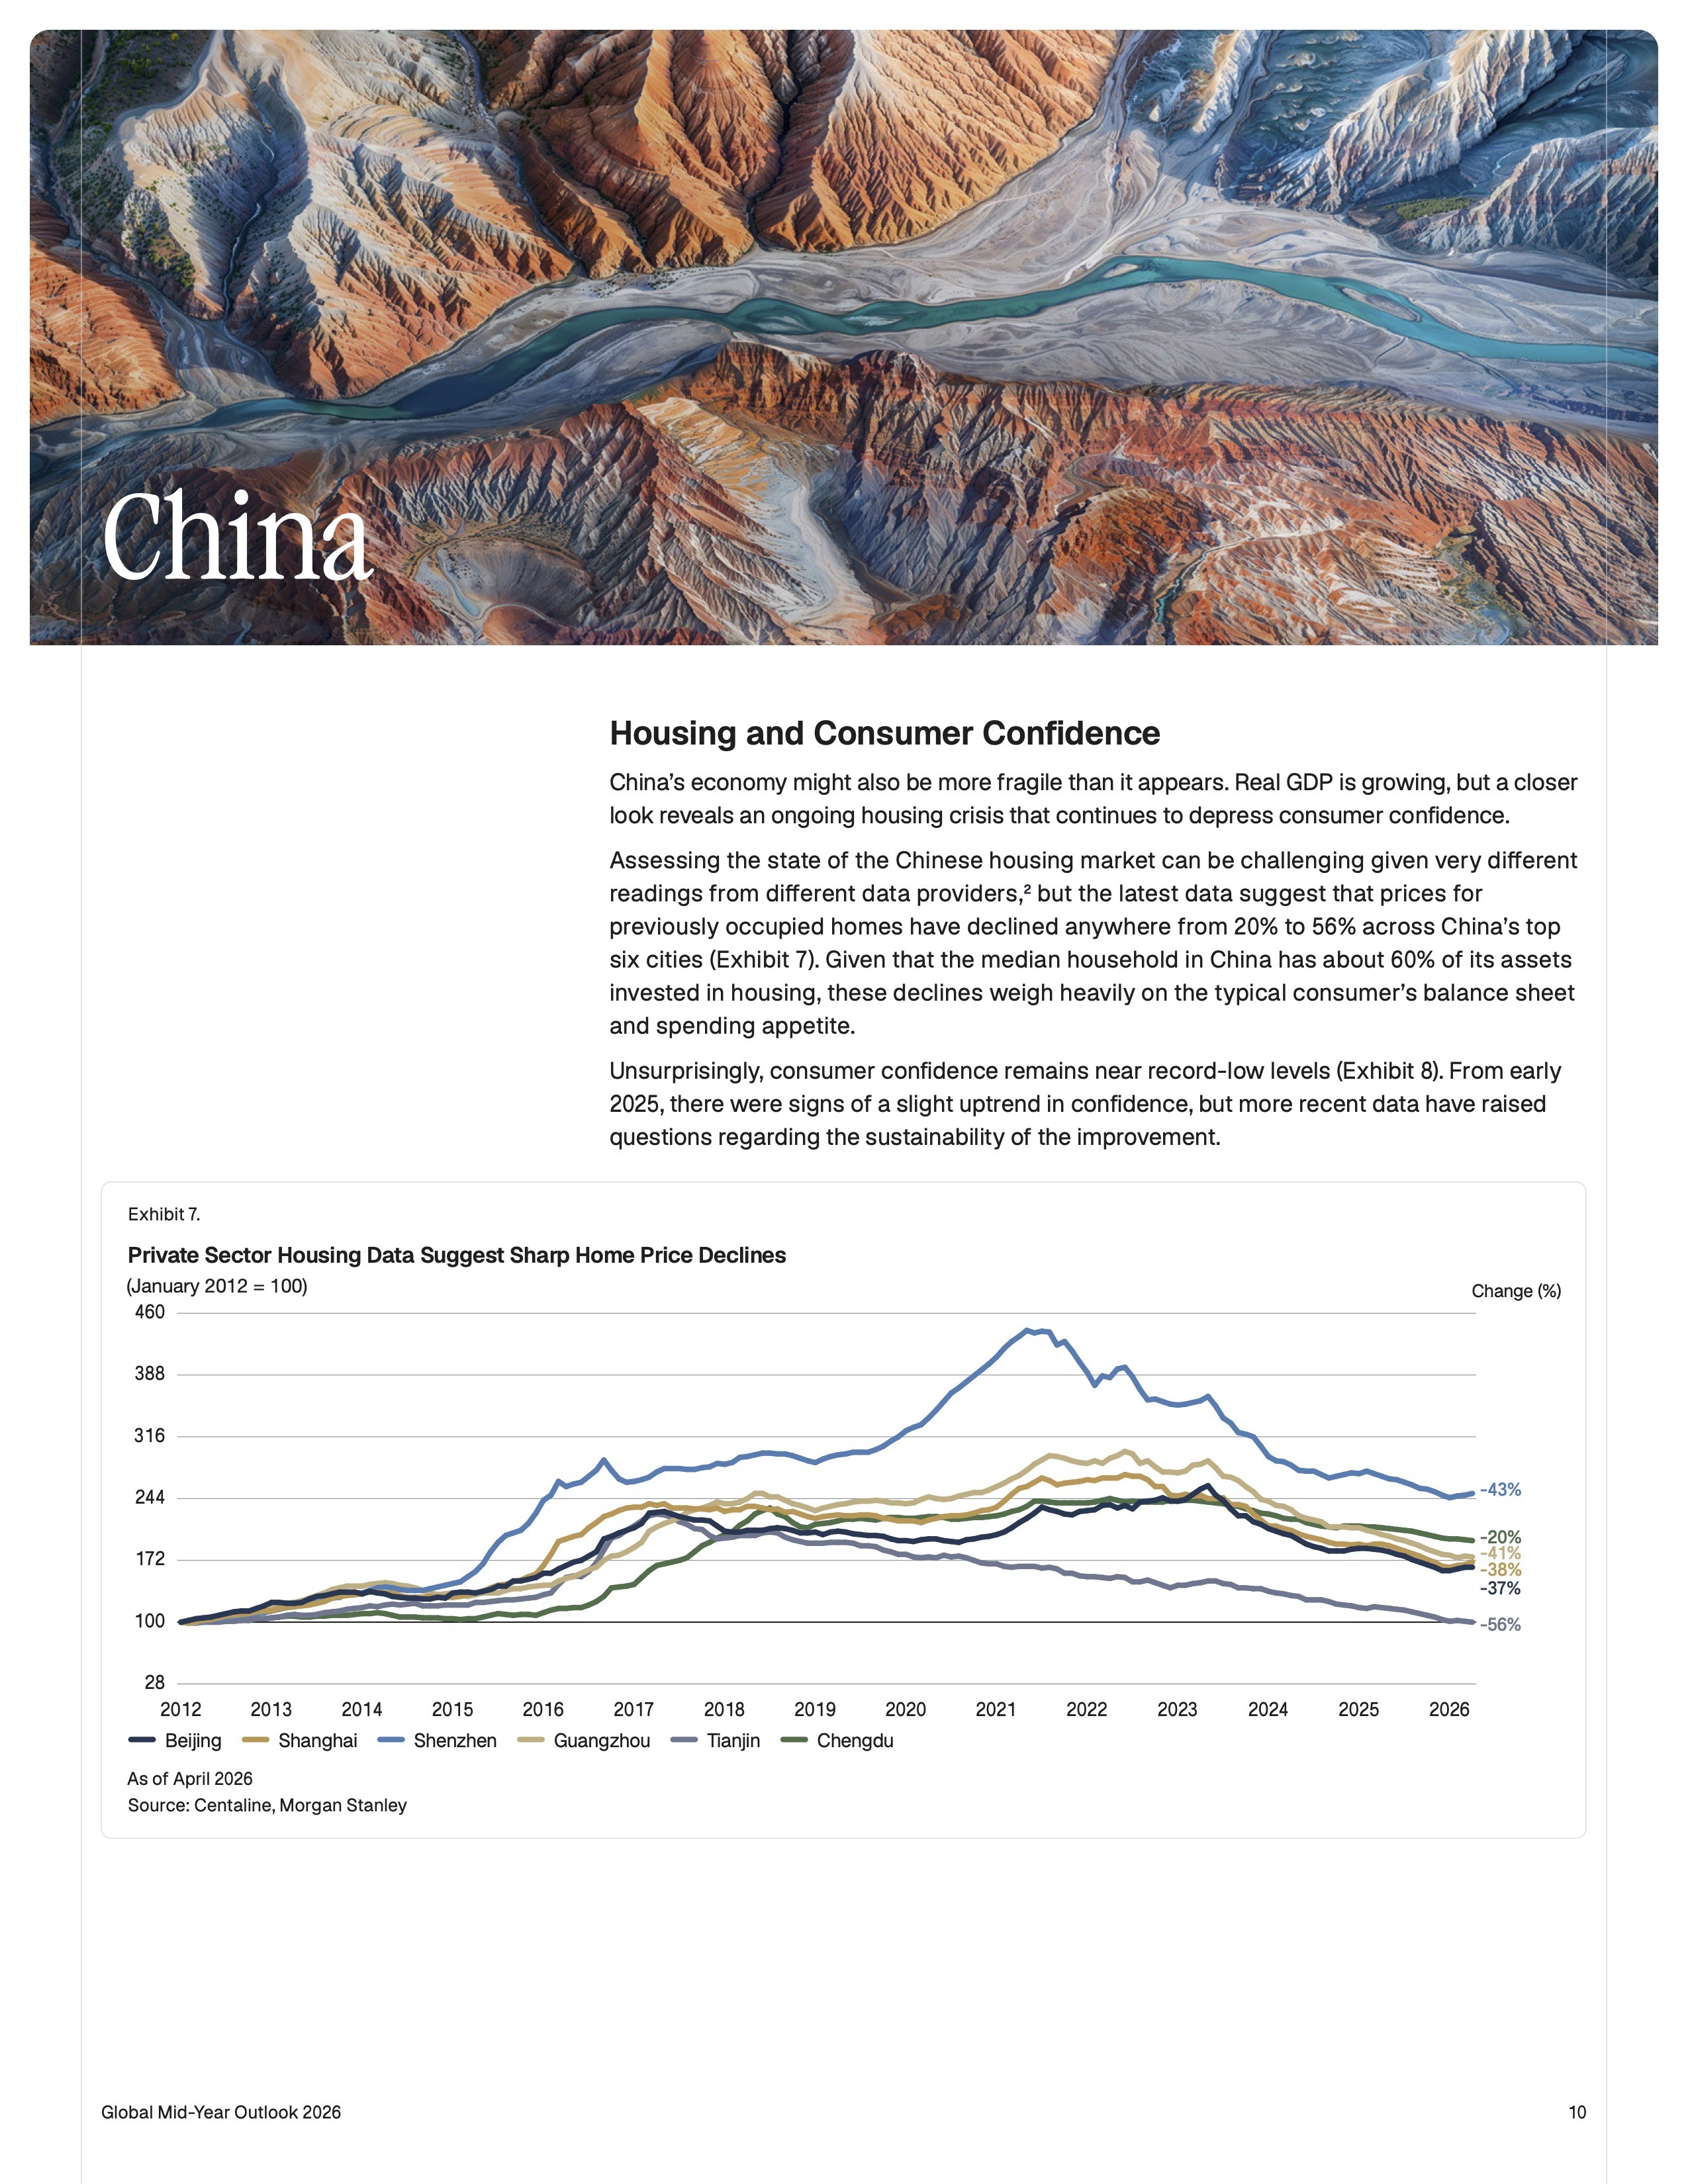
I used AI Imagery for data visualization, such as for the Global Mid-Year Outlook and Behind the Headlines campaigns.
With the feedback of my VP Design and Head of Design, I generated imagery based on geography unique to each region. I proposed an aerial lens for a "new angle" on our outlook.
Together, we launched the Outlook from start to end.



BEFORE
AFTER
UX to Increase Engagement
I also worked with the digital and channel marketing teams to architect the Outlook; previously, the site was a landing page, from where you could download the report.
The PDF report worked for institutional clients, but it drove little to negative impressions on our site.
Especially with our retail focus on ETFs, less time spent on site = less reach = less business.
BEFORE

Lazard's legacy digital platform was built on a fragmented, non-atomized architecture.
We therefore built off existing UX components to triage a production-ready site that felt new but recognizable.
In creating a more interactive experience, we drove:
AFTER

Finally, I introduced and scaled new forms of media for social (such as .gifs for LinkedIn) using Figma Motion; my work yielded:
